Climatic Risks in South American Coastal Ecosystems: A Mixed-Methods Review
Gustavo J. Nagy 1
 , Nathalie Muñoz 2 , Isabel C. Olivares 3 , Isaías Lescher Soto 4,5,*
-
Posgrado en Ciencias Ambientales, Instituto de Ecología y Ciencias Ambientales, Facultad de Ciencias, Universidad de la República, Iguá 4225, Montevideo, Uruguay
-
Centro Universitario Regional Este (CURE), Universidad de la República, Ruta 9, km 206, Rocha, CP, Rocha 27000, Uruguay
-
Programa de Ciencias Ambientales, Área de Tecnología, Universidad Nacional Experimental Francisco de Miranda, Santa Ana de Coro, Estado Falcón 4101, Venezuela
-
Escuela de Sociología, Universidad del Zulia, Maracaibo 4002, Zulia, Venezuela
-
Facultad de Humanidades y Educación, Universidad Privada Dr Rafael Belloso Chacín, Maracaibo 4002, Zulia, Venezuela
* Correspondence: Isaías Lescher Soto
Academic Editor: Thomas Fickert
Special Issue: Climate Change and Environment
Received: January 20, 2026 | Accepted: June 25, 2026 | Published: July 09, 2026
Adv Environ Eng Res 2026, Volume 7, Issue 3, doi:10.21926/aeer.2603019
Recommended citation: Nagy GJ, Muñoz N, Olivares IC, Soto IL. Climatic Risks in South American Coastal Ecosystems: A Mixed-Methods Review. Adv Environ Eng Res 2026; 7(3): 019; doi:10.21926/aeer.2603019.
© 2026 by the authors. This is an open access article distributed under the conditions of the Creative Commons by Attribution License, which permits unrestricted use, distribution, and reproduction in any medium or format, provided the original work is correctly cited.
Abstract
South America’s coastal ecosystems face increasing threats from multiple climatic stressors, including sea-level rise, ocean warming, intensifying heatwaves, shifts in ENSO patterns, ocean acidification, glacier melt, and more frequent extremes such as storms, droughts, and altered river discharges. These processes accelerate biodiversity loss, cause erosion, and deepen socio-ecological vulnerabilities. The literature review used a convergent mixed-methods approach with an embedded design, integrating quantitative bibliometric and statistical analyses with qualitative interpretation. One hundred open-access studies published between 2020 and 2025 were examined. The consulted literature revealed a concentration of scientific output in Brazil, an overrepresentation of mangrove and coral reef ecosystems, and a predominance of climate change and climatic variability as primary stressors, emphasising biogeophysical risks. To broaden the analytical scope, we conducted a Multiple Correspondence Analysis (MCA). It uncovered structural associations between stressor types, ecosystems, and risk categories. The MCA revealed coherent thematic nuclei and recurrent critical zones across all South American countries. Complementing this, a qualitative review of 35 case studies provided contextual depth. It illustrated how the convergence of climatic stressors with local pressures, such as urbanisation, land-use change, and environmental pollution, produces synergistic, spatially uneven risk configurations that transcend traditional analytical boundaries. Together, these methods expose a complex, interconnected web of climate-related threats affecting diverse coastal systems, from mangroves and wetlands to sandy beaches, estuaries, and fjords. The findings offer an integrated and comparative understanding of coastal risks in the region, providing evidence directly applicable to monitoring and adaptation strategies. Overall, this review shows that combining quantitative and qualitative approaches helps capture the multidimensional nature of compound climate risks and provides a robust foundation for strengthening the resilience of South America’s coastal socio-ecological systems.
Graphical abstract

Keywords
Climate change; ENSO variability; sea level rise; extreme weather; climatic stressors; biogeophysical risks; socio-ecological risks; bibliometry; thematic analysis
1. Introduction
Climate-induced risks have intensified globally in recent years, with stressors such as sea-level rise (SLR), ocean warming, ocean acidification, and increasingly frequent and intense extreme events (e.g., storm surges and hurricanes) reshaping coastal landscapes. These changes result in flooding, erosion, salinity intrusion, habitat and biodiversity loss, and infrastructure damage, leading to socio-ecological consequences such as declines in fisheries, loss of livelihoods, community displacement, and reduced resilience among both human and wildlife populations [1,2,3,4,5,6].
On the other hand, coastal areas, which support diverse species and human communities, are particularly vulnerable to climate change. Global warming and SLR disrupt sediment transport and degrade key habitats such as wetlands and nesting sites [7].
Coastal areas, particularly the low-lying coastal zones (LECZ), which are especially susceptible to SLR, El Niño Southern Oscillation (ENSO), and extreme weather, face increased risks of flooding, erosion, and ecosystem degradation, as well as threats to infrastructure, tourism, public health, and employment [3,4,8]. These processes modify coastal landscapes, functioning as socio-ecological systems (SES), shaped by interactions between natural processes and human activities. Environmental changes directly affect local communities, while choices regarding infrastructure development and resource management play a critical role in determining the resilience of these ecosystems [9,10].
1.1 Introducing the South American Context
Although scientific research output on South American coastal ecosystems has increased, these systems remain underrepresented in global syntheses compared to North American, European, and Indo-Pacific systems. This gap highlights the need for a regional-scale assessment.
South America’s coastlines (Figure 1) are ecologically rich and complex socio-ecological systems that are highly vulnerable to climate change, facing major challenges from SLR, storm surges, and increasingly warm and acidic oceans. These impacts threaten biodiversity, fisheries, habitats, infrastructure, and populations [11,12,13,14,15].

Figure 1 Map highlighting key coastal regions of South America, indicating the specific localities examined in this study. Visualisation produced using QGIS 3.34.1 (Prizren).
South America hosts globally significant coastal wetlands, salt marshes, mangroves, reefs, and other diverse habitats, all of which are increasingly threatened by climate change. These risks accelerate biodiversity loss and landscape instability, underscoring the urgent need for risk assessment and adaptation [11,16,17,18,19,20]. Within this context, South America provides a critical setting to examine how global and local climatic pressures interact with ecosystem responses. Notably, regions with minimal human intervention and dominant natural dynamics remain understudied, highlighting a key knowledge gap [21].
Landscape-scale climate risk analysis helps clarify vulnerabilities by providing a basis for effective environmental assessment. Coastal ecosystems depend on dynamic landforms that can degrade through erosion, subsidence, or flooding, triggering cascading risks for both natural systems and human communities. Key ecosystems such as beaches, dunes, and mangroves provide stability and resilience; however, they are increasingly threatened by climatic and human hazards, which undermine biodiversity, fisheries, and settlements in lowland coastal zones (LECZ) [2,3,4,22,23,24].
Figure 2 synthesises the primary and specific climatic stressors and the climate-related risks examined in this review. It also gives examples of ecological risks and impacts across South American coastal ecosystems. In this review, ‘primary climate stressor’ refers to broad climate factors like SLR, ocean warming, and climate variability. ‘Specific climatic stressors’ are the ways these factors affect coastal ecosystems, such as ENSO, marine heatwaves, hydrological droughts, and ocean acidification. These stressors are part of a larger set of pressures. They show how climate events interact with social, economic, and environmental factors to increase risks to ecosystems, people, and livelihoods. This framework offers a clear reference for researchers, international organizations, and government agencies tracking climate change impacts in the region.

Figure 2 Climate-related stressors and ecological risks.
The review uses a mixed-methods approach combining bibliometric analysis of publication trends with thematic analysis of key research areas and risks. We synthesised stressors and risks reported in the literature reviewed. We divided the risks into: Biogeophysical risks (BGPR), which are physical and biological challenges such as erosion and habitat loss. Socio-ecological risks (SER) affect human communities and their environments. Combined biophysical and socio-ecological impacts (B&S) occur when both risk types overlap. Rather than isolating individual stressors or ecosystems, this review addresses these risks and climate-related stressors across South American coastal ecosystems.
The integration of bibliometric and thematic approaches enables the identification of research patterns and knowledge networks, as well as the interpretation of how climatic stressors, ecosystem responses, and socio-ecological risks are represented in the literature.
Finally, this review focuses on studies published between 2020 and 2025, covering the most recent phase of climate-risk research following the publication of the IPCC Sixth Assessment Report (AR6). The review also reflects the rapid growth of scientific attention to compound climate risks, ecosystem resilience, and adaptation in South American coastal systems.
The development of this mixed-methods review is based on the following research questions (RQ):
RQ 1. How is research on the risks posed by climatic stressors to South American coastal ecosystems structured in terms of sources, institutions, countries, and thematic nuclei, based on bibliometric evidence from 2020 to 2025?
RQ 2. What climatic stressors are documented in the literature, and which of them most impact coastal-marine ecosystems in South America?
Subsidiary RQ on socio-ecological impacts (SRQ). Does the consulted literature identify compound climate stressors, defined as simultaneous or sequential climatic events, as increasing coastal risks and impacting coastal livelihoods and resource security?
This review is structured as follows: Section 2 details the research methodology; Section 3 presents the results of the bibliometric analysis; Section 4 develops the thematic analysis, including multiple correspondence analysis (MCA); Section 5 answers the research questions; and Section 6 presents the conclusions, limitations, future research directions, and the study’s contributions.
2. Materials and Methods
We employed a convergent mixed‑methods approach with an embedded design [25], integrating a quantitative bibliometric and statistical analysis with a qualitative examination of the findings through thematic analysis [26,27].
As South America forms part of the so-called Global South—a group of countries that face various constraints in producing, disseminating, and benefiting from internationally circulating scientific knowledge [28]—this study placed particular emphasis on methodological accessibility. A central criterion guided the process: ensuring that both the tools employed and the documents cited were accessible to authors and readers. We employed all tools used for information retrieval, processing, and analysis in their free versions, and the documents cited in the results are openly accessible.
In view of the foregoing considerations, this study proceeded through the following stages:
Stage 1 Search: We employed two databases for our search strategy. The first of these was https://www.lens.org/, which comprises more than 290 million scientific records, of which over 68 million are open access [28]. We applied the following search string: (“climate stressors” OR “climate change” OR “climatic change” OR “global warming” OR “sea level rise” OR “extreme events” OR “extreme weather” OR “coastal flooding” OR “ocean acidification” OR “coastal erosion” OR “climate risk” OR “coastal vulnerability” OR “storm surge”) AND (“coastal zone” OR “coastal system” OR “coastal ecosystem” OR “coastline” OR “littoral” OR “beach” OR “mangrove” OR “coral reef” OR “coastal wetland” OR “estuary” OR “dune” OR “salt marsh” OR “sandy shore” OR “rocky shore”) AND (“South America” OR “Argentina” OR “Brazil” OR “Chile” OR “Colombia” OR “Ecuador” OR “Guyana” OR “Paraguay” OR “Peru” OR “Suriname” OR “Uruguay” OR “Venezuela” OR “French Guiana”).
We applied these filters on https://www.lens.org/: Year Published 2020-2025, Publication Type as journal article or book chapter, and Open Access Color as gold. The Lens offers other filters, such as Green or Bronze. We did not use them, as they do not always provide the final, peer-reviewed, publisher-approved versions needed for content quality [29]. This search returned 1,408 documents.
Given that the study focuses on South America, https://search.scielo.org/ was employed as a second database. SciELO operates through networks in 15 countries, including 12 in Latin America, Portugal, Spain, and South Africa, and covers up to 1,000 journals, indexing more than 350 journals from these regions [30]. In this instance, the previously outlined search string was applied, albeit in Spanish and Portuguese.
In SciELO, we applied filters, including publication years 2020-2025, Languages: Spanish and Portuguese, Publication Type: journal article and book chapter, Collections: Argentina, Brazil, Colombia, Ecuador, Peru, Uruguay, and Venezuela, and Subject Areas: Biological Sciences and Exact and Earth Sciences. In this case, the authors retrieved 972 records.
We downloaded the documents via a CSV (Comma-Separated Values) file provided by https://www.lens.org/ and 65.bib files generated by https://search.scielo.org/. The files described above are available in Supplementary Material 1 (SM1). We used www.rayyan.ai to process these files. Rayyan is a web-based tool developed by the Qatar Computing Research Institute that uses text-mining methods and machine learning algorithms, specifically a Support Vector Machine classifier, to facilitate semi-automated screening of records for systematic reviews. Rayyan enables collaborative work among co-investigators, allowing them to independently assess the relevance of each uploaded document and classify it as ‘Included’, ‘Excluded’, or ‘Maybe’ [31]. In this study, Rayyan enabled the identification and removal of duplicates (38 exclusions), documents lacking identifiers that allowed processing (30 exclusions), the rapid review of titles and abstracts to identify and eliminate studies unrelated to the general terms of this study (1,340 exclusions), and finally a full text screening, which allowed the authors to select, one by one and by consensus, the documents to be included in the review by applying the inclusion and exclusion criteria outlined in Table 1.
Table 1 Inclusion and Exclusion criteria.
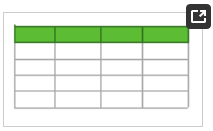
Of 972 documents checked, 9 were not found. This left 963 documents. The following reasons were used to exclude documents: EC1 (395), EC2 (194), EC3 (219), EC4 (25), and EC5 (30). After these exclusions, we kept 100 documents. Four reviewers independently assessed their level of agreement with one another. Fleiss’ Kappa [32] was used to determine whether the agreement exceeded chance. Overall agreement was calculated with this formula:
\[ k=\frac{\bar{P}-\bar{P}_e}{1-\bar{P}_e} \]
where $\bar{P}$ represents the mean of the proportion of agreeing pairs for each subject, and $\bar{P}_e$ is the proportion of agreement expected by chance alone.
Data analysis was conducted using Jamovi (version 2.6.44) with the Seolmatrix add-on, and results were independently verified using R (version 4.5.3). These tools enabled the calculation of agreement and the assessment of statistical significance. According to Landis and Koch [33], the Fleiss’ Kappa value was 0.814 (p < 0.001), indicating nearly perfect agreement. The reviewers agreed 92.6% of the time. All records, along with the Jamovi and R data files, are available in SM2.
As a subsequent step, a critical appraisal of the included documents was conducted to mitigate bias and strengthen the conclusions, ensuring that the integrity of the review was not compromised by low-quality studies [34]. The methodological quality of the selected literature was rigorously evaluated using a standardized five-criterion operational rubric, with cumulative scores determining the overall risk of bias categorization (see SM3). This rubric specifically examined: (Q1) clarity of objective and scope in defining specific climate stressors and coastal risks within the South American context; (Q2) methodological rigour and transparency of data sources and study periods; (Q3) mitigation of selection and sampling bias through clear, scientifically justified criteria for geographical or coastal community delimitation; (Q4) analytical and statistical robustness of the results; and (Q5) internal consistency and validity of the regional implications and conclusions derived from the data. Each dimension was assessed using a universal scoring system (0: Insufficient, 1: Partial/Moderate, 2: Yes/Robust), structuring three overall quality thresholds: High Quality/Low risk of bias (total score: 8-10), Moderate Quality/Moderate risk of bias (total score: 5-7), and Low Quality/High risk of bias (total score: 0-4).
Figure 3 presents the detailed results of this assessment, study by study. As illustrated by the individual distribution, the final corpus as a whole met robust methodological standards, placing all reviewed papers within the highest quality threshold. Nevertheless, this disaggregated analysis highlights the fine nuances and variations between perfect scores and those studies which, whilst remaining of high quality, exhibited minor, partial limitations within specific appraisal criteria.

Figure 3 Assessment of the quality of the sources consulted.
The PRISMA flow diagram offers an overview of the procedure outlined above (Figure 4).

Figure 4 PRISMA flow diagram according to Page et al. [35].
Stage 2 Bibliometric analysis: We added the documents selected through https://www.lens.org/ to a collection created on this platform. Once we completed the searches in both sources, the documents identified in SciELO were located in The Lens and manually incorporated into the same collection. The final collection comprised 100 documents, which were downloaded as a CSV file and employed for the bibliometric analysis (SM4). The appropriation of the CSV file generated from https://www.lens.org/ is supported by the following in-frame code: <iframe src = https://lens.org/lens/embed/attribution scrolling = “no” height = “30 px” width = “100%”></iframe>.
All bibliometric indicators are based on data from https://www.lens.org/, and we employed three software tools for data visualization. For the indicators Scholarly Works Over Time, Most active Countries/Regions, and Top institutions, SCimago Graphica Beta 1.0.53 was used, which enables exploratory analysis of complex data [36]. For the indicators, Co-occurrence analysis using all keywords and Bibliographic coupling, with Unit of Analysis: Documents, was employed using VOSviewer Software version 1.6.20, which is recognized for its free availability and ease of use [27].
It is important to note that, for the Co-occurrence analysis, the criteria considered were the density of the bibliographic corpus obtained from the review and the intention to provide greater visual clarity [37]. In this regard, the authors set the unit of analysis to “author’s keywords” with a minimum occurrence threshold of 2 to balance the network’s size with its analytical utility [38]. The remaining indicators addressed in VOSviewer used the open and default thresholds set by the software.
Stage 3 Thematic analysis: To conduct the thematic analysis, we developed a spreadsheet to record data from each selected document, including bibliographic information and the following categories: Primary Climatic Stressor, Specific Climatic Stressor, Ecosystem Types, Synergistic stressors, and Risk Types (SM5). The results of this initial categorization are shown in the statistical summary presented in Section 4.1.
Subsequently, we performed a Multiple Correspondence Analysis (MCA). MCA is a multivariate dimensionality-reduction method that extends correspondence analysis to encompass multiple categorical variables. Functioning as the counterpart to Principal Component Analysis for qualitative data, it projects complex structures into a two- or three-dimensional space to identify concurrent correlations and structural patterns [39]. Given the extensive number of categories, baseline contingency tables were initially constructed using the original parameters extracted from the literature. Subsequently, equivalent categories were homogenized, whilst extremely infrequent classifications (those with a single occurrence within the dataset) and ‘Not reported’ entries were removed. This preprocessing aimed to mitigate semantic redundancy and excessive sparsity in the categorical matrices before multivariate analysis [40]. Following this stage, Benzécri’s correction was applied to the resulting matrices. This adjustment was crucial for rescaling the inflated inertias and ensuring an accurate interpretation of the dimensions [41]. This workflow was executed using R (version 4.5.3) and the packages FactoMineR, factoextra, and ggplot2 (SM6).
We conducted a qualitative analysis based on a simplified version of the approach proposed by Naeem et al. [42], which involves identifying and reporting patterns within qualitative thematic relevance to patterns identified in the frequency analysis, adequate representation of clusters revealed by the MCA to capture structural diversity, incorporation of conceptual variability within and across themes, and inclusion of articles with sufficient methodological data. From the initial corpus of 100 high-quality studies, we purposively selected 35 case studies for the qualitative strand. Selection was guided by several considerations: strong conceptual detail for in-depth examination and the addition of studies addressing underrepresented themes to the statistical analysis to ensure analytical significance. The results of this qualitative approach are presented in Section 4.3.
To visualize the patterns emerging from the thematic analysis, we produced a single graphical representation. Visual mapping functions both as a process that enhances analytical clarity and as a product that enables readers to grasp the underlying reasoning [43]. Geographical mapping, in turn, provides a visual account of the spatial dynamics of the phenomena under study, allowing researchers to identify their actual spatial distribution, analyze spatial clustering, and examine the proximity between areas with differing characteristics [44]. Within this framework, we employed an infographic cartographic approach that integrates traditional thematic mapping with infographic techniques to present spatially relevant information in a clear, visually engaging manner [45]. Infographics, broadly defined, are visual representations that convey well‑structured explanations through cohesive graphic elements, and this principle extends to maps that adopt an infographic style [46].
This format prioritizes visual synthesis over strict cartographic detail, aligning the representation more closely with infographic‑oriented mapping while retaining essential spatial accuracy. We developed an infographic cartographic representation to illustrate the geographical distribution of cases compiled from the literature. Coordinates and specific locations extracted from sources (SM5) provide the most precise available data for each case. However, some may correspond to approximate or regionally representative positions, leading to minor spatial discrepancies. To construct the map, we transferred the data to a spreadsheet, exported it to https://app.datawrapper.de/ in Symbol map format, georeferenced it using QGIS 3.34.1, and refined the graphic elements, including colors, icons, and layout, in Adobe Illustrator 30.0.
3. Bibliometric Analysis Outcomes
This section maps scholarly production, highlights thematic patterns and institutional contributions, and outlines the intellectual landscape of climate-related coastal risks in South America. The analysis clarifies research foci and identifies gaps.
The parallel coordinates plot (Figure 5) depicts the evolution of scholarly output from 2020 to 2025 in the domains of climatic stressors, coastal risks, and South American coastal ecosystems.

Figure 5 Scholarly Works Over Time. Source: https://www.lens.org/. Visualization generated with SCImago Graphica.
Scholarly output surged during the study period. Document count jumped from 11 in 2020 to 19 in 2021 and 21 in 2022. From 2023 to 2025, output steadied at 16-17 documents per year. This trend shows that research accelerated before settling into a steady rhythm, rather than experiencing brief volatility.
Journal articles dominate output, comprising all publications in four of six years and averaging 15-21 annually. This reflects a strong preference for peer-reviewed journals and advances editorial standards in the field. The single 2023 book chapter, though rare, signals emerging collaborative or broader contributions.
This diversity matches the need for interdisciplinary climate risk research. Book chapters encourage varied perspectives. The data show broader research output, elevated editorial standards, and slight diversification of publication types. These changes highlight the value of a holistic review of research methods.
Following the assessment of publication and research trends, Figure 6 illustrates the geographical distribution of academic work on climate stress, coastal risks, and South American coastal ecosystems.

Figure 6 Most active Countries/Regions. Source: https://www.lens.org/. Visualization generated with SCImago Graphica. (Bubble map format). Note: The indicator’ Most active Countries/Regions’ in The Lens aggregates all author affiliations listed in each document (facet: Country/Region; metric: Document Count). The size of the circles represents the number of documents associated with each country, while their colors indicate each country’s location. No records were obtained for countries or regions that are not marked with circles.
Brazil leads South American coastal risk research, producing 49 documents. The United States (19) and Spain (11) contribute, reflecting international engagement in climate change impacts on South American coasts. Chile and Colombia each produce 11 documents, Argentina (6) and Uruguay (5) contribute less, while Peru, Ecuador, and Venezuela each have 3, and Guyana has 1. South American authors constitute 46% of contributors. This distribution reveals concentrated research in select countries with notable international collaboration.
Moving from the national picture to individual institutions, Figure 7 shows that Brazilian institutions produce most of the research on South American coastal systems facing climate stress. The Federal University of Rio de Janeiro and the University of São Paulo contribute the most. Other Brazilian universities, like the Universidade Federal do Rio Grande do Sul, the Federal University of São Paulo, and the Universidade Federal de Santa Catarina, are also important, highlighting Brazil’s strong academic presence in the region. This detailed institutional breakdown follows the broader country-level analysis presented above.

Figure 7 Top institutions. Source: https://www.lens.org/. Visualization generated with SCImago Graphica.
Beyond Brazilian universities, institutions such as the Center National de la Recherche Scientifique (France), the Galapagos Science Center (Ecuador), the National Scientific and Technical Research Council (Argentina), the Spanish National Research Council (Spain), and the University of Buenos Aires (Argentina) also participate. Together, these organizations show that research thrives on strong national efforts and international cooperation.
For the citation analysis in Table 2, we included only sources with at least 3 documents, and each document had at least 3 citations.
Of the 51 sources, only 9 met the criteria. The most cited journals were Frontiers in Marine Science (19 documents, 536 citations) and Scientific Reports (10 documents, 241 citations), with Nature Communications (3 articles, 266 citations) also ranking high. Although many authors are from Brazil, most of their work appears in top journals from Switzerland, the UK, and the US. Seven of the nine qualifying journals are Q1, indicating a focus on publishing in internationally recognized outlets, and four of them exhibit an h‑index above 100, reflecting a long-standing and substantial citation impact.
National journals have little presence. Ocean and Coastal Research (Brazil, Q3) and Sociedade & Natureza (Brazil, unranked) are the only highly cited local sources. This preference for global journals reflects the limited visibility of Latin American publications. Regional journals remain crucial for local research, even though most studies appear in Global North journals.
Turning to research themes, the co-occurrence analysis in Figure 8 used the author’s keywords and counted each. Only keywords that appeared at least twice were included, resulting in 22 out of 227 keywords being analyzed. These 22 keywords form the network’s nodes, with their total occurrences and link strengths shown in parentheses: climate change (10;13), coral reefs (5;7), physical oceanography (4;8), environmental sciences (3;7), climate-change ecology (3;6), coral bleaching (3;5), coral mortality (3;4), sea surface temperature (3;4), zoology (3;4), atmospheric science (2;7), climate sciences (2;5), marine biology (2;5), ocean sciences (2;5), climate-change impacts (2;4), environmental impact (2;4), South Atlantic Ocean (2;4), natural hazards (2;2), Patagonia (2;2), and sea level rise (2;2). Three keywords—remote sensing (3;1), coastal geomorphology (2;1), and extreme events (2;0)—did not connect with *others and were left out of the visualization. The clustering algorithm found 19 items, 40 links, and a total link strength of 49. This thematic analysis follows the prior citation and institutional evaluations, creating a coherent research narrative.

Figure 8 Co-occurrence analysis by the Author’s keywords. Visualization generated with VOSviewer. Software version 1.6.20. Note: Each color represents a cluster.
The analysis found four clusters. Cluster 1 (red) covers biophysical and ecological processes, including climate change ecology, marine biology, and physical oceanography. Cluster 2 (green) includes environmental and atmospheric topics such as climate science and natural hazards. Cluster 3 (blue) focuses on coral reef systems and issues like coral bleaching and sea surface temperatures. Cluster 4 (yellow) links climate change, Patagonia, and sea level rise, emphasizing geographic detail. The keyword network shows that most clusters are discipline-based, centering on coral reefs and climate impacts. This thematic structure demonstrates that selected keywords capture key disciplines and climate-sensitive systems, though not all ecosystem types are represented.
To further validate these thematic clusters, we applied two measures to the keyword co-occurrence network generated with VOSviewer and exported as a JSON file. The analysis in R version 4.5.3 (RStudio) yielded a modularity value of 0.4783, indicating that the clusters are well separated (values above 0.4 are good). The average silhouette width was 0.7786, showing strong cohesion within clusters (values above 0.7 are strong) [47]. These results confirm that the network’s structure is statistically sound. All related files and scripts are included in SM7.
Building on this, a bibliographic coupling analysis was conducted (Figure 9), using documents as the unit and requiring a minimum of 5 citations to ensure a strong network.

Figure 9 Bibliographic coupling. Unit of Analysis: Documents. Visualization generated with VOSviewer. Software version 1.6.20. Note: Each color represents a cluster.
Continuing with the bibliographic coupling results, 57 of 100 documents met the minimum requirement. The three most cited works were Almar et al. [48], “A global analysis of extreme coastal water levels with implications for potential coastal overtopping” (216 citations, red cluster); Mies et al. [49], “South Atlantic Coral Reefs Are Major Global Warming Refugia and Less Susceptible to Bleaching” (132 citations, purple cluster); and Leal Filho et al. [50], “Influences of Climate Change and Variability on Estuarine Ecosystems: An Impact Study in Selected European, South American and Asian Countries” (79 citations, light-blue cluster).
Although South American coastal ecosystems are central in these studies, they are not the exclusive focus. Each work positions South America within a wider global or regional context. This shows that impactful research considers the global complexity of climate risks to coastal and marine ecosystems, rather than focusing solely on local cases.
4. Thematic Analysis
This section presents a thematic analysis with a statistical summary (4.1) that categorizes the reviewed studies and identifies research trends in climatic stressors, affected ecosystems, and risk types. Following this, it reports the results of the Multiple Correspondence Analysis (MCA) (4.2) and then compares selected climatic stressors, ecosystems, risks, and impacts (4.3).
The thematic analysis reveals interconnected climatic stressors, geographic scales, impacts, and ecosystem vulnerabilities along South America’s coasts. The main risk categories are: biogeophysical risk paths (BGPR), socio-ecological risks (SER), and combined (or mixed) biophysical and socio-ecological impacts (B&S).
Key environmental drivers in the reviewed literature include SLR, ENSO variability, ocean warming and heatwaves, extreme events (storms), hydrological drought, glacier melt, and acidification. Their interaction with local landforms exacerbates the risks, impacting critical ecosystems such as mangroves, wetlands, coral reefs, sandy beaches, deltas, estuaries, and fjords. Physical risks include erosion, saltwater intrusion, and habitat loss; social risks include infrastructure damage; ecological risks include diminished natural services.
4.1 Statistical Summary
Figure 10 provides a statistical overview that groups the reviewed studies into broad categories, offering a general perspective on research trends concerning climatic stressors, affected ecosystems, and the types of risks reported.

Figure 10 Statistical summary. (a) Primary climatic stressors, (b) Main ecosystems studied, (c) Synergistic stressors, and (d) Risk types. Source: the authors.
Overall, 70% of the studies identify climate change (40%), climate variability (24%), or both (6%) as primary climatic stressors. In contrast, fewer studies examine related issues, such as ocean warming (12%), extreme weather events (8%), and sea-level rise (7%).
Building on these findings, the geographic origin of much of the research—primarily Brazil—shapes the focus of most studies towards mangroves (28%) and coral reefs (15%), with estuarine systems (14%) and sandy beaches (10%) also commonly examined.
In addition to climatic stressors and ecosystem types, land-use change (27%), urbanization (15%), and pollution (13%) are frequently identified as synergistic stressors, highlighting the interactions between human pressures and climate factors in South American coastal ecosystems.
When reporting impacts, most studies describe them as biogeophysical risks (60%), reflecting the frequent use of keywords from marine biology, ocean sciences, physical oceanography, atmospheric science, and climate sciences. Furthermore, 33% of studies report mixed risks, while a smaller group (7%) emphasizes socio-ecological risks.
4.2 Multiple Correspondence Analysis (MCA) Results
Figure 11 presents the results from the first Multiple Correspondence Analysis (MCA). This analysis shows that Primary Stressor, Ecosystem Type, Synergistic stressors, and Risk Type form distinct, strongly patterned groups in the literature. The first two dimensions account for 70.4% of the total corrected inertia (variance), indicating a well-structured ordination pattern. The horizontal axis explains 53.4% of the inertia and differentiates among variable groups, while the vertical axis explains 17% and further separates these groups.

Figure 11 MCA analysis. Association patterns regarding Primary Stressor, Ecosystem Type, Synergistic Stressors, and Risk Type.
The first dimension groups ecosystems and risk factors according to coastal human impact. On the negative side, mangroves, sandy beaches, estuaries, coastal plants, SLR, urbanization, pollution, land-use change, and mixed (B&S) risks form a cluster. This cluster demonstrates that most studies examine these ecosystems in the context of both climate stressors (especially sea-level rise) and human-related pressures. These pressures combine to produce physical and social impacts.
Coral reefs are grouped with climatic stressors, especially ocean warming and biogeophysical risks. Mangroves and related ecosystems are clustered with human-driven impacts, such as urbanization and pollution. This grouping highlights two contrasting coastal vulnerabilities: reefs are linked with global warming and acidification, whereas mangroves, beaches, and estuaries are associated with local human pressures. Large coastal systems in the Atlantic and Pacific Oceans, and fjords, are grouped by natural or physical stressors, prompting research focused on ocean dynamics and productivity. In contrast, kelp forests under overexploitation form a distinct cluster, with distinct impact mechanisms. Ecosystems like coastal dunes, barrier islands, and wetlands occupy intermediate positions and do not belong to well-defined groups.
Figure 12 addresses specific climatic stressors, local responses, ecosystem types, and risk kinds. The first two dimensions explain 44.2% of the total corrected inertia, revealing distinct regional impact patterns. The plot demonstrates how local conditions correlate with risk mechanisms, with the horizontal axis explaining 27.3% of the inertia and the vertical axis 16.9%.

Figure 12 MCA analysis. Association patterns among Specific Climate Stressors, Location, Ecosystem Type, and Risk Type.
The first dimension (horizontal) separates the Pacific domain (negative side) from the Atlantic domain (positive side), with Colombia — a country with coastlines on both oceans — appearing at both extremes or in intermediate positions, depending on which coastline is considered. On the negative side, Peru is associated with the Pacific macrosystems, which, according to the reviewed literature, are strongly influenced by ENSO and regional oceanographic dynamics. Closer to the center, sandy beaches appear, affected by storms linked to ENSO. On the positive side, the tropical Caribbean countries (Colombia, Guyana, and Venezuela) cluster together, as they are associated in the literature with SLR and, to a lesser extent, extreme climatic events. These impacts primarily affect mangroves and coastal dunes. Uruguay, the only temperate-climate country in the southeastern Atlantic represented in this gradient, is likewise linked to SLR in the reviewed studies.
The second dimension (vertical) introduces an additional differentiation based on specific climate stressors and types of impact. On the negative side, studies identify links between ocean warming, marine heatwaves, and precipitation extremes, with these mechanisms driving increased coral bleaching, ecosystem disruption, and altered hydrological cycles, primarily in the Atlantic macrosystems and in countries such as Ecuador with thermal anomalies. On the positive side, the Chilean fjords and certain estuaries are highlighted, with conditions altered by changing precipitation and river discharge, causing shifts in salinity, water quality, and ecosystem resilience. This pattern is particularly notable in Argentina and Uruguay, where hydrological variability and precipitation extremes drive central impact mechanisms.
Taken together, the plot reveals a strong geographical structuring of climate risk impacts along the South American coast. The tropical Pacific, driven by ENSO and oceanic dynamics, influences Peru and its sandy beaches by intensifying storm activity, causing coastal erosion and habitat disruption. The Caribbean and tropical Atlantic coast (Colombia, Guyana, and Venezuela) are characterized by SLR and extreme events, resulting in mangrove and dune loss. Uruguay, in the temperate southeastern Atlantic, aligns with this group due to prominent sea-level rise, which is causing flooding and habitat shifts. The second dimension separates ocean warming and marine heatwaves, which drive changes in the Atlantic macrosystems and Ecuador, from drought and river discharge variability, which affect fjords, estuaries, Argentina, and Uruguay (Rio de la Plata) by altering the hydrological balance and ecosystem conditions. This synthesis directly links geographical context to specific climatic mechanisms and impact pathways affecting ecosystem and risk types along the South American coast.
4.3 Comparison of Selected Climatic Stressors, Ecosystems, Impacts, and Risks
Table 3 summarises 35 case studies exemplifying the key topics in this review. It details climatic stressors categorized as primary, specific, and synergistic, along with the corresponding ecosystems, impacts, and risk categories. SER requires explicit human outcomes, while B&S requires both explicit human and biophysical or ecological outcomes. The case studies were selected according to three criteria: relevance to the MCA, avoidance of overrepresentation of stressors and ecosystems, and the inclusion of clearly defined cases. Based on these criteria, Table 3 illustrates the impacts of climate change on coastal ecosystems in South America. The table organizes information by linking stressors, affected ecosystems, combined pressures, and resulting risk types. This approach facilitates the identification of patterns, emerging concerns, and shared vulnerabilities across ecosystems, which are critical for regional risk assessments.
Table 3 Case Studies showing Climatic Stressors (primary, specific, synergistic), ecosystems, impacts, and prevailing risk types.
The 35 case studies from the reviewed articles reveal a consistent pattern. Coastal ecosystems that previously had distinct structures and functions are now responding similarly to climate pressures. This convergence is driven not only by climate change but also by persistent local human impacts. These impacts destabilize ecosystems. For instance, Amazonian mangroves are experiencing increased salinity. Coral reefs are affected by marine heatwaves. Beaches are undergoing morphological changes. Accelerated meltwater flows influence fjords. These impacts represent enduring changes that diminish ecosystems’ capacity to recover. Some ecosystems once considered resilient or naturally protected are now exhibiting unpredictable responses, with evidence of threshold exceedance and persistent losses in some cases, including repeated mass die-offs, sustained hypoxia, and disrupted hydrological connectivity. New vulnerabilities are emerging, with risks accumulating and extending into some regions that previously buffered environmental shocks. This development may signify a substantial shift, with South America confronting a complex network of compound risks that can alter ecological stability in affected areas.
Figure 13 shows the intersections of climate stressors, coastal ecosystems, and risk pathways in South America. Rather than listing individual impacts, the MCA (Figure 11 and Figure 12) and Figure 13 illustrate how climate stressors, coastal ecosystems, and risk pathways converge to create coastal risk patterns in South America. Comparing physical drivers, ecosystem types, and related risks reveals how vulnerability changes by location and how cumulative pressures threaten deltas, reefs, mangroves, fjords, and sandy shores. This approach creates a clear, unified view of coastal risks from diverse data sources.

Figure 13 Intersections of climate stressors, coastal ecosystems, and risk pathways in South America. Visualization: Datawrapper, refined and georeferenced in QGIS 3.34.1, and finalized in Adobe Illustrator 30.0. Source: the authors based on the cited references in Table 3.
Figure 13 primarily serves as a communication tool that translates intersections from statistical and qualitative analyses into a cartographic-infographic format. It does not show magnitudes or intensities but highlights structural relationships among stressors, ecosystems, and risks. It illustrates their spatial convergence and overlapping pressures across the region. Visualizing the continental distribution of the 35 cases provides a synthesis that supports comprehension for researchers and decision-makers, and helps broaden the public’s understanding of compound risks.
5. Synthesis of Evidence and Analysis of Research Questions
This section synthesises and discusses the findings from Sections 3 and 4, referencing sources in Table 3 to address the research questions (RQs). In addition, it incorporates sources from the introduction and recent publications in 2026. Finally, the study’s limitations are examined.
5.1 RQ 1: How is Research on the Risks Posed by Climatic Stressors to South American Coastal Ecosystems Structured in Terms of Sources, Institutions, Countries, and Thematic Nuclei, Based on Bibliometric Evidence from 2020 to 2025?
Section 3’s bibliometric analysis directly tackled RQ 1, shedding light on key patterns and insights.
Between 2020 and 2025, research in this field has grown rapidly, but there are still big differences in where studies are done, which institutions are involved, and what topics are covered. Brazilian universities lead the way in coastal and marine research in South America, with the largest networks of researchers and institutions. At the same time, Argentina, Chile, Colombia, Ecuador, Peru, Uruguay, and Venezuela have also contributed, though to a lesser extent, to research. Significant differences in literary output among countries may result from variations in population size, coastline length, and economic strength. In this context, Uruguay, Chile, and Colombia are the most prolific contributors in the 100-article sample and the case studies. However, this selection may introduce sampling bias.
The top publications are in well-known international journals such as Frontiers in Marine Science, Scientific Reports, and Nature Communications. Only one South American journal ranks among the most-cited.
Citation patterns show South America’s mixed role in global climate science. For example, of the three most cited articles in the analysis, only Mies et al. [49] focus exclusively on a South American ecosystem, the South Atlantic coral reefs. In contrast, Almar et al. [48] and Leal Flho et al. [50] are global studies that include South America.
Looking at how topics are connected, there are groups focused on coral reefs and related issues, including coral bleaching, coral death, global warming, and sea surface temperatures. Other groups focus on ecosystems, biodiversity, climate change, environmental science, and physical oceanography. This shows that the field is primarily focused on climate impacts and ecosystem concepts, with coral reefs as a main focus. In contrast, topics on landform changes are less common, suggesting that physical coastal processes are included but less important than ecological and biodiversity issues.
In summary, the field is growing, driven by strong national centers, international partnerships, and groups focused on ecosystems, especially studies about how coral reefs respond to climate stress.
Section 4 provides answers to RQ 2 and the subsidiary question. First, we analyze the 100 basic documents (e.g., Figures 10-13), and then focus on the 35 case-study documents listed in Table 3.
5.2 RQ 2: What Climatic Stressors are Documented in the Literature, and Which of Them Most Impact Coastal-Marine Ecosystems in South America?
Figures 10 to 13 show that the 100 documents used in this study on South American coasts often categorize climate stressors as ENSO, ocean warming and marine heatwaves; SLR and coastal erosion; storm surges; drought and changes in river flow; glacier melt, and acidification. Figure 10 shows that the most frequently addressed topics are climate change and variability, extreme weather, and SLR. The ecosystems most commonly examined include mangroves, coral reefs, estuaries, sandy beaches, and, to a lesser degree, shelf and open-ocean areas, and coastal wetlands. Regarding synergistic stress factors, land use is most often cited, followed by natural and physical factors, urban expansion, and pollution. Most papers focus on biogeophysical risks (60%), with mixed risks at 33%, and only 7% addressing socio-ecological risks.
The multicomponent analysis (MCA) (Figure 11: Primary Stressor, Synergistic Stressors, Ecosystem Type, and Risk Type), which accounts for 70% of the total inertia among the variables considered, reveals distinct clusters within the literature.
SLR is the most prominent primary stressor across both dimensions (Ds) [68,83,84], while warming strongly influences D1 (accounting for 53.4% of the variability). Coral reefs are associated with warming [60,67,72,76] on D1, whereas mangroves align with cooling on the opposite side of D1. Land-use does not show a significant association in the MCA, despite frequent citation (e.g., [53,56,58,73,81]). Urbanization closely aligns with D1 and socio-ecological risk [64,78].
Although the MCA (Figure 12: Specific Climate Stressors, Location, Ecosystem Type, and Risk Type) accounts for 44% of the total corrected inertia, it effectively highlights local conditions. The Rio de la Plata estuary (Argentina-Uruguay) is strongly associated with D1 and changes in river discharge [50,71]. Marine heatwaves and warming are also strongly associated with D1 but are moderately linked to Ecuador, Peru, and the Pacific macrosystems [64]. Uruguay is positioned on the opposite side of this association [51].
The infographic in Figure 13 illustrates the intersections between ecosystems and risks along South American coastlines. However, the accumulation of factors, e.g., ENSO, SLR, thermal stress, hydrological and landscape changes, while consistent with the cited literature, should not be interpreted as an estimate of combined stressors and compound risks.
The 35 case studies (Table 3) summarise the principal and specific climatic stressors, synergistic stressors, associated ecosystems, effects, and risk categories. The applied selection criteria applied to the 100-article list moderated the representativeness of Brazil and of stressors and risks. The analysis covers all countries in the region except Suriname. Brazil is represented by 14 articles, followed by Colombia (N = 6), Chile (N = 5), Argentina (N = 4), Uruguay (N = 4), and Peru (N = 3). Each remaining country has a single article. Regarding the primary stressors, Climate change and variability are the focus of 26 articles (e.g., [54,59,61,74,77,85]), covering a broad range, followed by Ocean warming (N = 8) (e.g., [53,60,67,75]) and SLR (N = 4) (e.g., [56,68,83,84]). The specific stressors cover the full range, mainly ENSO, heatwaves, erosion, and storms. The same applies to the synergistic stressors, with urbanization and land-use changes being the most common. The ecosystem impacts include harm to mangroves, corals, and the coastal physical landscape, as well as to organisms. Finally, Biogeophysical risks (BGPR) (e.g., [57,62,65,66,80]) and mixed risks (B&S) (e.g., [55,58,69,79]) were each reported 17 times, while socio-ecological impacts (SER) were reported six times (e.g., [78,82,84]).
In summary, the consulted literature shows that South American coastal ecosystems already face significant impacts from climatic stressors such as ocean warming and heatwaves [51,63,67,76,86], SLR, flooding, and erosion (e.g., [19,24,56,68,72]), acidification [58,62], increased ENSO variability [50,54,57,64,70,78], and extreme events (e.g., [19,50,54,64,71,79]). These stressors increase risks and impacts on the analyzed ecosystems (e.g., [8,14,17,19,86,87,88,89]).
5.3 SRQ: Does the Consulted Literature Identify Compound Climate Stressors, Defined as Simultaneous or Sequential Climatic Events, As Increasing Coastal Risks and Impacting Coastal Livelihoods and Resource Security?
Multiple climate stressors amplify biogeophysical and socio-environmental risks along South America’s coasts. Hazards such as SLR, storm surges, and flooding often strike together or in sequence, threatening livelihoods and coastal infrastructure [68,71,72,82,84].
The convergence of stressors increases compound risks to coastal ecosystems and the essential services they provide [52,68,72,75,76]. Communities that depend on these resources lose food security, experience lower incomes, face greater competition for limited resources, and risk losing their cultural traditions [82,84].
In summary, referenced research on climate stressors and related risks in South America builds on previous studies that have informed risk assessments, highlighting South America’s coastal regions as places where impactful climate forces intersect with complex social and economic dynamics. This convergence increases vulnerability and complicates community adaptation.
Recent scholarly articles from 2026 support the previously discussed assertions and provide insight for future research. Mazzuco et al. [86], for example, highlight the growing threat posed by recurrent marine heatwaves to macroalgal cover and biodiversity along Brazil’s southwest Atlantic coast. Likewise, Basnayake et al. [90] report that, at the IPCC AR6 regional scale, Northern South America has the highest median coastal vulnerability index (CVI), ranging from very low to very high worldwide. Northern South America (Venezuela, Guyana, French Guiana, Suriname) shows a very high CVI, the southeastern region (Brazil, Uruguay, and part of Argentina) a high CVI, the Southern (part of Argentina) and Southern West (part of Argentina and Chile) regions a low CVI, and the Northwestern (Peru, Ecuador, Colombia) region a moderate CVI. A paper by Buscaglia et al. [91] found that viral communities in subpolar fjords are highly sensitive to warming, potentially altering community diversity, structure, chemical cycles, and food web interactions in Chilean Patagonian fjords. Finally, Arana-Ruedas et al. [92] argue that climate services need to be better connected, user-focused, and tailored to local needs to close the gap between research and real-world action. Improving digital systems, encouraging regional cooperation, and working together to develop climate services are key steps to boosting climate resilience and supporting adaptation planning in South America.
5.4 Strengths and Limitations
This review synthesizes recent evidence from all South American coastal countries except one, covering diverse climatic hazards, ecosystems, and impacts. It offers an updated, structured overview of how climate change and variability influence climate risks in the region.
This review uses two open-access databases, The Lens and SciELO, which may exclude relevant articles from hybrid or subscription-based journals. Nevertheless, this approach enabled a detailed review, rigorous quality assessment, sorting of findings, and thorough analysis. The methodology is fully replicable without paid database access. This is particularly advantageous for researchers in South America.
Besides choosing databases, focusing on 2020 to 2025 might limit the scope of the review. However, this period includes research done before and after the Sixth Assessment Report of the Intergovernmental Panel on Climate Change (IPCC) (2021-2023). This approach covers different views and key examples of regional events. It also avoids depending too much on older studies. It also prevents over-reliance on older studies.
6. Conclusions
This review relies on a transparent, reproducible workflow using open-access tools to investigate trends in climatic stressors and ecosystem impacts in South American coastal regions. By integrating multiple methods, the study provides a comprehensive analysis that reveals critical interactions among climatic stressors, risks, and socio-environmental impacts.
The research landscape is changing rapidly, but remains uneven. National research centers, notably in Brazil, and international editorial platforms significantly shape visibility and priorities in this field.
Gradual climatic changes, such as ocean warming, sea-level rise, acidification, and glacier melt, interact with ENSO, droughts, and extreme weather to amplify, compound, and intensify risks and socio-ecological impacts. Strengthening foresight and early warning systems is essential to address the accelerating threats posed by climate change and variability.
Mangroves and coral reefs are the most affected, with sandy beaches and estuarine systems also significantly affected. Ocean warming, marine heatwaves, ENSO events, storms, sea level rise, and synergistic non-climate stressors further exacerbate these effects. Notably, increasing ocean temperatures are particularly impacting coral reefs and macroalgae in the Southwestern Atlantic, especially off the coast of Brazil.
While bibliometric and statistical analyses identify specific stressors, regions, and ecosystems, integrating quantitative data with qualitative interpretation reveals a more complex reality. Many ecosystems across all South American coastal countries face combined risks from interactions among climatic and anthropogenic stressors. This convergence creates major challenges for researchers and policymakers, especially in delineating, quantifying, and documenting risk exposure. Strengthening these analytical capacities is crucial to diversifying and customizing adaptive strategies to address each territory’s unique conditions and needs.
Beyond global climate change mitigation, effective interventions depend on improved monitoring. Reducing coastal vulnerability and risks requires coordinated, transdisciplinary efforts. observation, sustained long-term monitoring, high-resolution time-series data, integrated coupled models, and socio-ecological assessments that link risk exposure to adaptation strategies.
Future research should focus not only on the ecosystems we found are more often reported in the cited sources (mangroves and coral reefs), but also on the less-studied ones (estuaries, sandy beaches, and fjords). It is also important to check whether certain combinations of pressures and ecosystems are associated with higher risk, to identify new risk areas and to track changes over time in ecosystem health, risk, and recovery capacity. These research areas should be supported by studies on climate change management, especially those that provide the information needed for decision-making. In this area, recent progress in machine learning and artificial intelligence could be very important.
Author Contributions
Dr Gustavo J. Nagy contributed to Conceptualization, Methodology, Software, Validation, Formal analysis, Investigation, Resources, Data curation, Writing – original draft preparation, Writing – review and editing, Supervision, Visualization, Project administration and Funding acquisition. Prof Nathalie Muñoz contributed to Conceptualization, Software, Validation, Resources, Data curation, and Visualization. Dr Isabel C. Olivares contributed to Conceptualization, Software, Validation, Resources, Data curation, and Visualization. Dr Isaías Lescher Soto contributed to Conceptualization, Methodology, Software, Formal analysis, Investigation, Resources, Data curation, Writing – original draft preparation, Writing – review and editing and Visualization.
Competing Interests
The authors have declared that no competing interests exist.
Data Availability Statement
The link provided below contains the following supplementary materials (SMs) in Mendeley Data: https://data.mendeley.com/datasets/vn77pk6fjp/1.
AI-Assisted Technologies Statement
The authors did not use generative artificial intelligence tools in the conception, development, or writing of this manuscript. We transparently disclose the use of the following AI‑assisted technologies, which supported specific technical aspects of the workflow but did not generate ideas, interpretations, or substantive content.
- Grammarly Premium (https://www.grammarly.com/): Used to review the entire text and to refine clarity and conciseness. Paraphrasing functions were applied cautiously to preserve academic rigor and authorial intent.
- Rayyan (https://www.rayyan.ai): Used as a digital environment to facilitate the screening, organization, and consensus‑based selection of studies included in the literature review.
The authors are fully responsible for the content of the manuscript, including all text that was revised with the assistance of these tools, and remain accountable for any issues related to publication ethics.
Additional Materials
The following additional materials are uploaded at the page of this paper.
References
- Dangendorf S, Hay C, Calafat FM, Marcos M, Piecuch CG, Berk K, et al. Persistent acceleration in global sea-level rise since the 1960s. Nat Clim Change. 2019; 9: 705-710. [CrossRef] [Google scholar]
- Guild R, Wang X, Quijón PA. Climate change impacts on coastal ecosystems. Environ Res. 2024; 3: 042006. [CrossRef] [Google scholar]
- Intergovernmental Panel on Climate Change (IPCC). Climate Change 2022 – Impacts, Adaptation and Vulnerability: Working Group II Contribution to the Sixth Assessment Report of the Intergovernmental Panel on Climate Change [Internet]. Cambridge, UK: Cambridge University Press; 2023. Available from: https://www.cambridge.org/core/books/climate-change-2022-impacts-adaptation-and-vulnerability/161F238F406D530891AAAE1FC76651BD.
- Nagy GJ, Krishnapillai M, Saroar M, Olivares-Aguilera IC. Climate risks, resilience and adaptation in coastal systems. Front Clim. 2023; 4: 1090577. [CrossRef] [Google scholar]
- Ocean Acidification International Coordination Centre. Climate change impacts on coastal ecosystems: Ocean Acidification [Internet]. Monaco: OA-ICC; 2025. Available from: https://news-oceanacidification-icc.org/2025/01/03/climate-change-impacts-on-coastal-ecosystems/.
- United Nations Environment Programme. The world’s corals are bleaching. Here’s why and what it means for the ocean’s future [Internet]. Nairobi, Kenya: UNEP; 2026. Available from: https://www.unep.org/news-and-stories/story/worlds-corals-are-bleaching-heres-why-and-what-it-means-oceans-future.
- Xu L. Impact of climate change on coastal morphology: A comprehensive analysis. J Coast Zone Manage. 2023; 26: 586. [Google scholar]
- Intergovernmental Panel on Climate Change (IPCC). Oceans and Coastal Ecosystems and Their Services. In: Climate Change 2022 – Impacts, Adaptation and Vulnerability: Working Group II Contribution to the Sixth Assessment Report of the Intergovernmental Panel on Climate Change. Cambridge, UK: Cambridge University Press; 2023. pp. 379-550. [CrossRef] [Google scholar]
- Kanan AH, Giupponi C. Coastal socio-ecological systems adapting to climate change: A global overview. Sustainability. 2024; 16: 10000. [CrossRef] [Google scholar]
- Refulio-Coronado S, Lacasse K, Dalton T, Humphries A, Basu S, Uchida H, et al. Coastal and marine socio-ecological systems: A systematic review of the literature. Front Mar Sci. 2021; 8: 648006. [CrossRef] [Google scholar]
- Liu Y, Li J, Wang X, Sun C, Tian P, He G. Divergent dynamics of coastal wetlands in the world’s major river deltas during 1990-2019. Int J Appl Earth Obs Geoinf. 2024; 134: 104218. [CrossRef] [Google scholar]
- Lobo FJ, dos Passos Nascimento JL, Durán R, López-Quirós A, Guillén J, Pereira F, et al. Geomorphological features along the shelf of the southern Brazilian margin: Implications for shallow-water sediment transport induced by ocean currents. Geomorphology. 2024; 456: 109215. [CrossRef] [Google scholar]
- Woodroffe CD. Biogeomorphological inheritance: The legacy of past landforms constrains future tropical coastal landscapes. Earth Surf Process Landf. 2025; 50: e70013. [CrossRef] [Google scholar]
- Intergovernmental Panel on Climate Change (IPCC). Central and South America. In: Climate Change 2022 – Impacts, Adaptation and Vulnerability: Working Group II Contribution to the Sixth Assessment Report of the Intergovernmental Panel on Climate Change. Cambridge, UK: Cambridge University Press; 2023. pp. 1689-1816. [CrossRef] [Google scholar]
- World Meteorological Organization. Extreme weather and climate impacts bite Latin America and Caribbean [Internet]. Geneva, Switzerland: WMO; 2025. Available from: https://wmo.int/news/media-centre/extreme-weather-and-climate-impacts-bite-latin-america-and-caribbean.
- Carneiro PB, Ximenes Neto AR, Jucá-Queiroz B, Teixeira CE, Feitosa CV, Barroso CX, et al. Interconnected marine habitats form a single continental-scale reef system in South America. Sci Rep. 2022; 12: 17359. [CrossRef] [Google scholar]
- Rodríguez-Fonseca B, Calvo-Miguélez E, Sánchez IP. Impact of climate variability and change on south american marine ecosystems. Oxford Research Encyclopedia of Climate Science. New York, NY: Oxford University Press; 2025. [CrossRef] [Google scholar]
- Friedlander AM, Ballesteros E, Caselle JE, Hüne M, Adler AM, Sala E. Patterns and drivers of benthic macroinvertebrate assemblages in the kelp forests of southern Patagonia. PLoS One. 2023; 18: e0279200. [CrossRef] [Google scholar]
- Vallarino-Castillo R, Negro-Valdecantos V, del Campo JM. A systematic review of oceanic-atmospheric variations and coastal erosion in continental Latin America: Historical trends, future projections, and management challenges. J Mar Sci Eng. 2024; 12: 1077. [CrossRef] [Google scholar]
- Schoeman DS, Bolin JA, Cooley SR. Quantifying the ecological consequences of climate change in coastal ecosystems. Camb Prism Coast Futur. 2023; 1: e39. [CrossRef] [Google scholar]
- Soares MO, Bezerra LE, Copertino M, Lopes BD, Barros KV, Rocha-Barreira CA, et al. Blue carbon ecosystems in Brazil: Overview and an urgent call for conservation and restoration. Front Mar Sci. 2022; 9: 797411. [CrossRef] [Google scholar]
- Calbet A. Sea-level rise: A looming catastrophe. In: The ocean of today, the legacy of tomorrow: Navigating the future of marine life and ecosystems. Cham: Springer; 2025. pp. 31-40. [CrossRef] [Google scholar]
- Stoll MM, Deutsch CA, Jurikova H, Rae JW, Frenzel H, Gothmann AM, et al. A century of change in the California current: Upwelling system amplifies acidification. Nat Commun. 2025; 16: 9661. [CrossRef] [Google scholar]
- United Nations Framework Convention on Climate Change. Sea Level Rise: This is a second draft version of the knowledge synthesis product developed by the UNFCC Slow Onset Event (SoE) Expert Group, the subgroup focused on sea level rise and coastal risks [Internet]. Bonn, Germany: UNFCCC; 2024. Available from: https://unfccc.int/sites/default/files/resource/SoE%20Technical%20guida%20SLR_second_draft_clean_080824.pdf.
- Forni P, Grande PD. Triangulation and mixed methods in contemporary social sciences [Triangulación y métodos mixtos en las ciencias sociales contemporáneas] (In Spanish). Rev Mex Sociol. 2020; 82: 159-189. [CrossRef] [Google scholar]
- Azarian M, Yu H, Shiferaw AT, Stevik TK. Do we perform systematic literature review right? A scientific mapping and methodological assessment. Logistics. 2023; 7: 89. [CrossRef] [Google scholar]
- Marzi G, Balzano M, Caputo A, Pellegrini MM. Guidelines for bibliometric‐systematic literature reviews: 10 steps to combine analysis, synthesis and theory development. Int J Manage Rev. 2025; 27: 81-103. [CrossRef] [Google scholar]
- Soto IL, Vidal B, Verger L, Nagy GJ. Mapping the trajectory of planetary health education—A critical and constructive perspective from the global south. Challenges. 2025; 16: 50. [CrossRef] [Google scholar]
- Peeters FV. Opening doors to discovery: Partnerships are key to advancing open science. Inf Serv Use. 2021; 41: 171-176. [CrossRef] [Google scholar]
- Costa SM, Pereira LS, Silva KA. Intersectionalities in internationalization studies: An overview of Brazilian research. J Comp Int Higher Educ. 2023; 15: 5. [CrossRef] [Google scholar]
- Valizadeh A, Moassefi M, Nakhostin-Ansari A, Hosseini Asl SH, Saghab Torbati M, Aghajani R, et al. Abstract screening using the automated tool Rayyan: Results of effectiveness in three diagnostic test accuracy systematic reviews. BMC Med Res Methodol. 2022; 22: 160. [CrossRef] [Google scholar]
- Fleiss JL. Measuring nominal scale agreement among many raters. Psychol Bull. 1971; 76: 378-382. [CrossRef] [Google scholar]
- Landis JR, Koch GG. The measurement of observer agreement for categorical data. Biometrics. 1977; 33: 159-174. [CrossRef] [Google scholar]
- Farooq MS, Hamid A, Alvi A, Omer U. Blended learning models, curricula, and gamification in project management education. IEEE Access. 2022; 10: 60341-60361. [CrossRef] [Google scholar]
- Page MJ, McKenzie JE, Bossuyt PM, Boutron I, Hoffmann TC, Mulrow CD, et al. The PRISMA 2020 statement: An updated guideline for reporting systematic reviews. BMJ. 2021; 372: n71. [CrossRef] [Google scholar]
- Hassan-Montero Y, De-Moya-Anegón F, Guerrero-Bote VP. SCImago graphica: A new tool for exploring and visually communicating data. Prof Inf. 2022; 31: e310502. [CrossRef] [Google scholar]
- Abdelmoneim AA, Kimaita HN, Al Kalaany CM, Derardja B, Dragonetti G, Khadra R. IoT sensing for advanced irrigation management: A systematic review of trends, challenges, and future prospects. Sensors. 2025; 25: 2291. [CrossRef] [Google scholar]
- Rejeb A, Rejeb K, Simske SJ, Keogh JG. Blockchain technology in the smart city: A bibliometric review. Qual Quant. 2022; 56: 2875-2906. [CrossRef] [Google scholar]
- Liu L, Cao C, Song W. Bibliometric analysis in the field of rural revitalization: Current status, progress, and prospects. Int J Environ Res Public Health. 2023; 20: 823. [CrossRef] [Google scholar]
- Makino N. Simultaneous object and category score estimation in joint correspondence analysis. Psychometrika. 2025; 90: 982-997. [CrossRef] [Google scholar]
- Camiz S, Gomes GC. Alternative methods to multiple correspondence analysis in reconstructing the relevant information in a Burt’s table. Pesqui Oper. 2016; 36: 23-44. [CrossRef] [Google scholar]
- Naeem M, Ozuem W, Howell K, Ranfagni S. A step-by-step process of thematic analysis to develop a conceptual model in qualitative research. Int J Qual Methods. 2023; 22. doi: 10.1177/1609406923120578. [CrossRef] [Google scholar]
- Van der Walt T. “Show, don’t tell”: Using visual mapping to chart emergent thinking in self-reflexive research. J Educ. 2020; 76-96. doi: 10.17159/2520-9868/i78a05. [CrossRef] [Google scholar]
- Rucks-Ahidiana Z, Bierbaum AH. Qualitative spaces: Integrating spatial analysis for a mixed methods approach. Int J Qual Methods. 2015; 14: 92-103. [CrossRef] [Google scholar]
- Zhang X, Xu Y, Li K, Yu L, Liu Y. ChinaVis24.MapCraft: Dissecting and designing custom geo-infographics. J Vis. 2025; 28: 837-857. [CrossRef] [Google scholar]
- Koníček J, Voženílek V, Barvíř R, Vondráková A. Quantitative approach for assessing infographics in Atlas cartography. Geogr Cassoviensis. 2024; 18: 46-65. [CrossRef] [Google scholar]
- Sheriff N, Sevukan R. Exploration of data literacy research using a network of cluster mapping approach. J Scientometr Res. 2023; 12: 130-143. [CrossRef] [Google scholar]
- Almar R, Ranasinghe R, Bergsma EW, Diaz H, Melet A, Papa F, et al. A global analysis of extreme coastal water levels with implications for potential coastal overtopping. Nat Commun. 2021; 12: 3775. [CrossRef] [Google scholar]
- Mies M, Francini-Filho RB, Zilberberg C, Garrido AG, Longo GO, Laurentino E, et al. South Atlantic coral reefs are major global warming refugia and less susceptible to bleaching. Front Mar Sci. 2020; 7: 514. [CrossRef] [Google scholar]
- Leal Filho W, Nagy GJ, Martinho F, Saroar M, Erache MG, Primo AL, et al. Influences of climate change and variability on estuarine ecosystems: An impact study in selected European, South American and Asian countries. Int J Environ Res Public Health. 2022; 19: 585. [CrossRef] [Google scholar]
- Artana C, Rodrigues RR, Fevrier J, Coll M. Characteristics and drivers of marine heatwaves in the western South Atlantic. Commun Earth Environ. 2024; 5: 555. [CrossRef] [Google scholar]
- Azkue MF, D’Onofrio EE. Contributions of rising mean river level of the Río de la Plata estuary on recorded changes in positive storm surges. Ocean Coast Res. 2024; 72: e24055. [CrossRef] [Google scholar]
- Baratto J, Terassi PM, Galvani E. Changes in vegetation cover and the relationship with surface temperature in the Cananéia-Iguape coastal system, São Paulo, Brazil. Remote Sens. 2024; 16: 3460. [CrossRef] [Google scholar]
- Baratto J, de Bodas Terassi PM, de Beserra de Lima NG, Galvani E. Precipitation anomalies and trends estimated via satellite rainfall products in the Cananeia–Iguape coastal system, southeast region of Brazil. Climate. 2024; 12: 22. [CrossRef] [Google scholar]
- Barros EL, de Souza Pinheiro L, Guerra RG, de Moura FJ, de Paula DP, Neto AR, et al. Shoreline change and coastal erosion: An analysis of long and short-term alterations and mitigation strategies on the coast of Icapuí, Northeast Brazil. Rev Bras Geomorfol. 2024; 25: e2604. [CrossRef] [Google scholar]
- Cavalcante JD, Lima AM, Silva JC, Holanda BS, Almeida CA. Temporal analysis of the mangrove forest at the Mocajuba River hydrographic Basin-Pará. Floresta Ambient. 2021; 28: e20200073. [CrossRef] [Google scholar]
- da Costa Silva TR, Magalhães A, Procópio AD, de Andrade MP, Pereira LC, Costa RM. El Niño-driven changes in zooplankton community structure in an amazonian tropical estuarine ecosystem (Taperaçu, Northern Brazil). Coasts. 2025; 5: 39. [CrossRef] [Google scholar]
- de Deus Vidal Junior J, Mori GM, Cruz MV, da Silva MF, de Moura YA, de Souza AP. Differential adaptive potential and vulnerability to climate-driven habitat loss in Brazilian mangroves. Front Conserv Sci. 2022; 3: 763325. [CrossRef] [Google scholar]
- De La Maza L, Farías L. The intensification of coastal hypoxia off central Chile: Long term and high frequency variability. Front Earth Sci. 2023; 10: 929271. [CrossRef] [Google scholar]
- Duarte GA, Villela HD, Deocleciano M, Silva D, Barno A, Cardoso PM, et al. Heat waves are a major threat to turbid coral reefs in Brazil. Front Mar Sci. 2020; 7: 179. [CrossRef] [Google scholar]
- Echeverry Hernandez JP, Mancera Pineda JE, Sánchez Núñez DA. Migration of deltaic and open water mangrove forests in response to environmental factors. Front Mar Sci. 2025; 12: 1569857. [CrossRef] [Google scholar]
- Friedlander AM, Ballesteros E, Goodell W, Hüne M, Muñoz A, Salinas-de-León P, et al. Marine communities of the newly created Kawésqar National Reserve, Chile: From glaciers to the Pacific Ocean. PLoS One. 2021; 16: e0249413. [CrossRef] [Google scholar]
- Gaspar TL, Quimbayo JP, Ozekoski R, Nunes LT, Aued AW, Mendes TC, et al. Severe coral bleaching of Siderastrea stellata at the only atoll in the South Atlantic driven by sequential marine heatwaves. Biota Neotrop. 2021; 21: e20201131. [CrossRef] [Google scholar]
- Guzman E, Ramos C, Dastgheib A. Influence of the El Niño phenomenon on shoreline evolution. Case study: Callao bay, Peru. J Mar Sci Eng. 2020; 8: 90. [CrossRef] [Google scholar]
- Korb CC, Guasselli LA, Hasenack H, Belloli TF, Cunha CS. Temporal and spatial variability of hydrogeomorphological attributes in Coastal Wetlands—Lagoa do Peixe National Park, Brazil. Coasts. 2025; 5: 23. [CrossRef] [Google scholar]
- León-Muñoz J, Aguayo R, Corredor-Acosta A, Tapia FJ, Iriarte JL, Reid B, et al. Hydrographic shifts in coastal waters reflect climate-driven changes in hydrological regimes across Northwestern Patagonia. Sci Rep. 2024; 14: 20632. [CrossRef] [Google scholar]
- Lucas CC, Teixeira CE, Braga MD, Júnior FC, Paiva SV, Gurgel AL, et al. Heatwaves and a decrease in turbidity drive coral bleaching in Atlantic marginal equatorial reefs. Front Mar Sci. 2023; 10: 1061488. [CrossRef] [Google scholar]
- Manzolli RP, Cantillo-Sabalza M, Portz L. Assessing erosion and sediment removal in the Isla Salamanca coastal barrier: Implications for the Barranquilla-Ciénaga highway and coastal marine biodiversity–Colombia. Geo Mar Lett. 2024; 44: 2. [CrossRef] [Google scholar]
- Monteiro MC, Perreira LC, da Costa RM. Effects of climate events on the trophic status of an Amazonian estuary. Limnol Rev. 2024; 24: 313-334. [CrossRef] [Google scholar]
- Murillo-Sandoval PJ, Fatoyinbo L, Simard M. Mangroves cover change trajectories 1984-2020: The gradual decrease of mangroves in Colombia. Front Mar Sci. 2022; 9: 892946. [CrossRef] [Google scholar]
- Nagy GJ, Verocai JE, Capurro L, Gómez-Erache M, Gutiérrez O, Panario D, et al. Climate Risks and Reasons for Concern along the Uruguayan Coast of the Rio de la Plata Estuary. Estuary Research-Recent Advances. London, UK: IntechOpen; 2023. [Google scholar]
- Olivares-Aguilar IC, Sánchez-Dávila G, Wildermann NE, Clark D, Floerl L, Villamizar E, et al. Methodological approaches to assess climate vulnerability and cumulative impacts on coastal landscapes. Front Clim. 2022; 4: 1018182. [CrossRef] [Google scholar]
- Pereira RL, Mösso C, Pereira LCC. Assessment of vulnerability to erosion in Amazonian beaches. Geographies. 2025; 5: 29. [CrossRef] [Google scholar]
- Pinilla E, Ross L, Perez-Santos I. Exchange flow in a highly stratified fjord in drought conditions. Front Mar Sci. 2024; 11: 1458758. [CrossRef] [Google scholar]
- Risaro DB, Chidichimo MP, Piola AR. Interannual variability and trends of sea surface temperature around southern South America. Front Mar Sci. 2022; 9: 829144. [CrossRef] [Google scholar]
- da Conceição Sabadini S, Carvalho-Ribeiro SM, Leão ZM, de Azevedo Ruchkys Ú, de Kikuchi RK, Soares Filho BS. Modelling susceptibility of Abrolhos reefs to coral bleaching. Desenvolv Meio Ambiente. 2020; 54: 312-342. [CrossRef] [Google scholar]
- Santana-Piñeros AM, Cruz-Quintana Y, May-Tec AL, Mera-Loor G, Aguirre-Macedo ML, Suarez-Morales E, et al. The 2015-2016 El Niño increased infection parameters of copepods on Eastern Tropical Pacific dolphinfish populations. PLoS One. 2020; 15: e0232737. [CrossRef] [Google scholar]
- Santos GM, Schneider VE, Cemin G, Poletto M. Identifying the areas at risk of huaico occurrences in the department of Lima, Peru. Climate. 2025; 13: 11. [CrossRef] [Google scholar]
- Sepúlveda M, Quiñones RA, Esparza C, Carrasco P, Winckler P. Vulnerability of a top marine predator to coastal storms: A relationship between hydrodynamic drivers and stranding rates of newborn pinnipeds. Sci Rep. 2020; 10: 12807. [CrossRef] [Google scholar]
- Sharif WR, Da Silva PN. Fungal diversity in selected coastal mangrove ecosystems in East Berbice Corentyne, Guyana, South America. GSC Biol Pharm Sci. 2021; 17: 138-146. [CrossRef] [Google scholar]
- Sierra Luna VA, Vásquez-Salazar DF, López de Mesa LA, Ocampo-Rojas MA, Guzmán-Alvis ÁI, Cantera Kintz J. Functional analysis of benthic macrofauna in mangroves of the tropical Eastern Pacific (Colombian Pacific coast). Estuar Coast Shelf Sci. 2025; 316: 109181. [CrossRef] [Google scholar]
- Touza J, Lacambra C, Kiss A, Amboage RM, Sierra P, Solan M, et al. Coping and adaptation in response to environmental and climatic stressors in Caribbean coastal communities. Environ Manage. 2021; 68: 505-521. [CrossRef] [Google scholar]
- Thiéblemont R, Le Cozannet G, D’Anna M, Idier D, Belmadani A, Slangen AB, et al. Chronic flooding events due to sea-level rise in French Guiana. Sci Rep. 2023; 13: 21695. [CrossRef] [Google scholar]
- Uribe-Castañeda N, Satizabal CA, Herrera Orozco L, Cantera Kintz JR. Ecosystems services vulnerability of Uramba Marine Protected Area. Bol Investig Mar Costeras. 2020; 49: 95-118. [CrossRef] [Google scholar]
- Warner J, Alaica AK. Contextualizing the influence of climate and culture on bivalve populations: Donax obesulus malacology from the north coast of Peru. J Isl Coast Archaeol. 2024; 19: 150-171. [CrossRef] [Google scholar]
- Mazzuco AC, Gaurisas DY, Vassoler A, Coppo GC, de Oliveira Pacheco CF, Araujo GA, et al. Marine heatwaves shift intertidal marine communities in the SW Atlantic. PeerJ. 2026; 14: e20858. [CrossRef] [Google scholar]
- da Silveira Bueno C, Paytan A, de Souza CD, Franco TT. Global warming and coastal protected areas: A study on phytoplankton abundance and sea surface temperature in different regions of the Brazilian South Atlantic Coastal Ocean. Ecol Evol. 2024; 14: e11724. [CrossRef] [Google scholar]
- Hagen I, Huggel C, Ramajo L, Chacón N, Ometto JP, Postigo JC, et al. Climate change-related risks and adaptation potential in Central and South America during the 21st century. Environ Res Lett. 2022; 17: 033002. [CrossRef] [Google scholar]
- Soares MD, Campos CC, Carneiro PB, Barroso HS, Marins RV, Teixeira CE, et al. Challenges and perspectives for the Brazilian semi-arid coast under global environmental changes. Perspect Ecol Conserv. 2021; 19: 267-278. [CrossRef] [Google scholar]
- Basnayake V, Duong TM, Ranasinghe R, Almar R, Wijnberg KM. A global assessment of coastal vulnerability and dominant contributors. Nat Commun. 2026; 17: 578. [CrossRef] [Google scholar]
- Buscaglia M, Castillo-Inaipil W, Schulz F, Guajardo-Leiva S, Iriarte JL, Aparicio-Rizzo P, et al. Unveiling the viral frontier in a warming world: Temperature as a key ecological driver of viral diversity in subantarctic Chilean Patagonia fjords. Environ Microbiome. 2026; 21: 41. [CrossRef] [Google scholar]
- Arana-Ruedas DP, Pino-Vargas E, del Águila-Ríos S, Ramos-Fernández L. Digital transformation in climate change management: Tools for managing droughts, floods, and frost in South America: A systematic review. Front Clim. 2026; 8: 1765251. [CrossRef] [Google scholar]